Experiencing issues while navigating your WHMCS or finding errors on your website can be perplexing and bothersome. Thankfully, enabling debugging mode can provide you with specific details about these errors, facilitating quicker resolutions. This guide offers a step-by-step procedure to activate debugging in WHMCS, cPanel, and Plesk.
WHMCS Debugging Mode: A Simplified Breakdown
Common Errors Encountered in WHMCS
While operating within WHMCS, you might stumble upon errors such as:
- “Oops! Something went awry, and we couldn’t process your request.”
- Completely blank pages.
- The dreaded 500 Internal Server error.
These can be resolved by diving into debugging mode, outlined below:
Activating Debugging Mode in WHMCS
- Initial Login: Begin by signing into your WHMCS Admin dashboard.
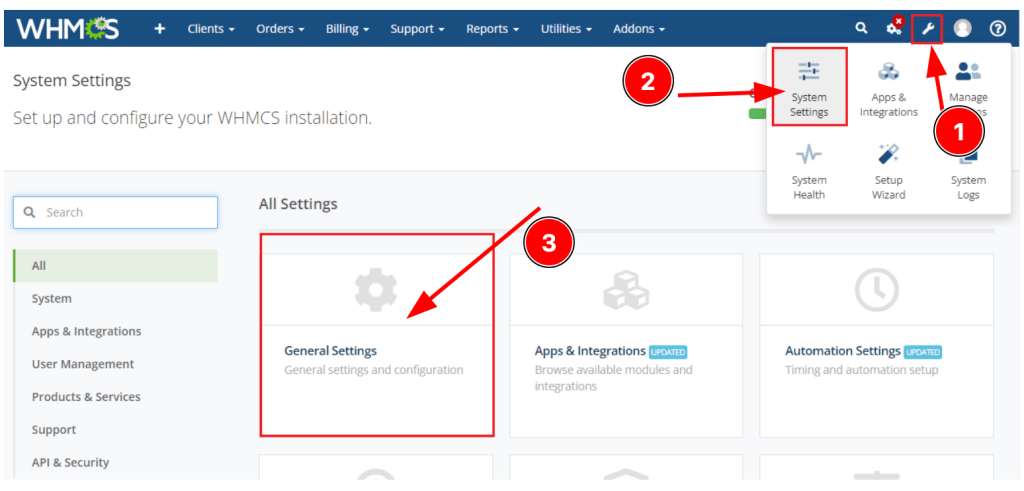
- Navigating to Debug Settings: Depending on your WHMCS version:
- For WHMCS 8.3.7 and newer: Configuration > System Settings > General Settings > Other Tab

- For versions before WHMCS 8.3.7: Setup > General Settings > Other Tab

- Selecting Debugging Preferences: At the bottom of the page, you’ll find several debugging options:
- Display Errors: Enables PHP Error display. Note: not ideal for regular operations.
- Log Errors: Allows logging of PHP Errors when viable. Best avoided for everyday use.
- SQL Debug Mode: For logging SQL Errors. Strictly for testing.
- Hooks Debug Mode: To log Hook Calls. Again, purely for testing.
After activating the required debugging options, revisit the problematic page. The specific error details should now be visible, aiding in quicker diagnostics. If the issue is beyond your expertise, you can always share the error details with your third-party vendor or module provider.
Remember: Always disable the ‘Display Errors’ feature after troubleshooting to maintain your site’s security.
Manual Debugging Via Configuration File
If you’re unable to access the WHMCS admin dashboard or prefer a manual approach:
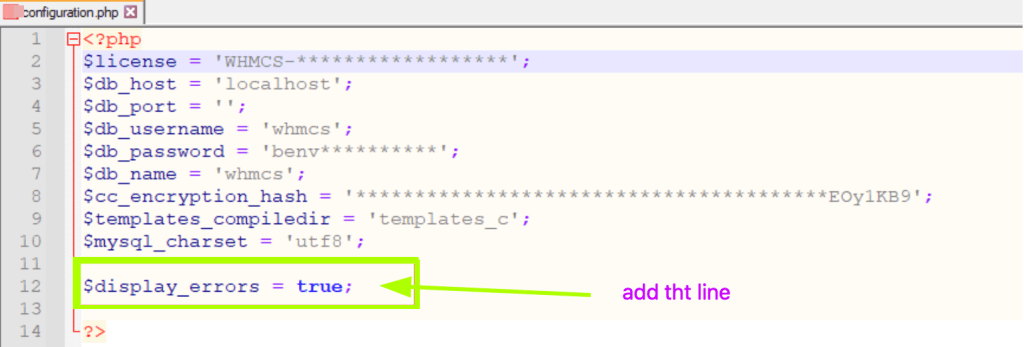
- Use FTP, cPanel, Plesk, or any other tool to access the WHMCS root directory.
- Find and edit the configuration.php file.
- Just before the closing PHP tag (?>), add:
$display_errors = true;
- Save and re-upload this modified file.
Now, as you revisit the page, it should disclose the error specifics, offering clarity.
Safety Tip: Post-diagnosis, remember to remove the aforementioned code. Keeping this active can risk your website’s security.
Debugging in cPanel and Plesk
For cPanel:
- Log into your cPanel dashboard.
- Within the “Software” category, locate “Advanced” or “Advanced Options”.
- Click on “PHP Configuration” or “Select PHP Version”.
- In the PHP settings, set “error_reporting” to “E_ALL”.
- Enable the “display_errors” option.
- Confirm the changes.
For Plesk:
- Access your Plesk dashboard.
- Choose the domain or subscription needing debugging.
- Head to “Websites & Domains”.
- Depending on Plesk’s version:
- Plesk Onyx or Obsidian: Click “PHP Settings” under “Hosting Settings”.
- Plesk 12.x: Navigate to “Website Scripting and Security” > “PHP Settings”.
- In PHP settings, set “error_reporting” to “E_ALL”.
- Activate the “display_errors” option.
- Validate your adjustments.
Note: Debugging mode, when active in cPanel or Plesk, can display warnings and errors on the site. Once you’ve addressed the issues, ensure you deactivate this mode to safeguard sensitive information and optimize site performance.
Wrapping Up
The Debugging Mode, especially in WHMCS, acts as an indispensable toolkit for problem-solving. By following this detailed guide, you unlock the potential to swiftly identify and rectify complications, making your web management journey smoother and more efficient. Always ensure you safeguard your website’s integrity and security by disabling debugging modes after use.

